

CSV Graph Tool

CSV Graph Tool介绍
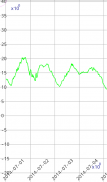
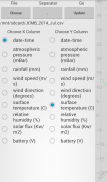
Graphs CSV files (a format Excel exports to). Various services export CSV data such as Admob, Flurry, various android apps, and data related applications. You can pick 2 columns, one for x, and the other for y to graph.
Consider Installing a file browser on your device. This app will let you pick CSV files directly from the file browser from within CSV Grapher, and via touching a CSV file from your file browser of choice via open with dialog.
- Supports multiple data delimiter (TAB, semicolon, space, and etc...).
- Data is auto sorted based on the X chosen column before plotting
- format auto detected to be either number or date
- Pan and zoom/scale X & Y independently. .
- Very optimized for speed. Browse more than 10K data points smoothly.
If your csv file doesn't work, just email a sample representative of your file and I'll see what I can do to get it working.
If you tried this app, be sure to rate :D. Talk about the app on Reddit here: http://www.reddit.com/r/valeonom feature requests? bugs? comments? or anything else are welcome.
<b>Time Formats</b>
The best date time format to use is the following
yyyy-MM-dd HH:mm:ss Z example: 2014-12-31 23:59:59 -0800
yyyy-MM-dd HH:mm:ss example: 2014-12-31 23:59:59
yyyy-MM-dd HH:mm example: 2014-12-31 23:59
yyyy-MM-dd example: 2014-12-31
There are others that are supported. If you are generating the CSV file and want best support/performance use one of the above as it minimizes ambiguity.
By default the timezone GMT is assumed if not specified. Furthermore the displayed timezone in the graph is GMT. Which means is if your timezones that are specified are not GMT (e.g. your local time) then the graph vertical lines for the days will be when the day changes if it were GMT.
</div> <div jsname="WJz9Hc" style="display:none">图表CSV文件(格式的Excel出口)。各种服务中导出CSV数据例如AdMob,乱舞,各类Android应用,以及相关的数据应用。你可以选择两列,一为X,和其他为y以图表。
请考虑在设备上安装一个文件浏览器。这个程序将让你从文件浏览器从CSV绘图中直接挑CSV文件,并通过与经开对话接触,从你选择的文件浏览器一个CSV文件。
- 支持多种数据分隔符(TAB,分号,空间,等..)。
- 数据的排序基于X所选列绘制之前自动
- 格式的自动检测为任何数字或日期
- 平移和缩放/缩放X和Y独立。 。
- 速度非常优化。浏览10K以上的数据点顺利。
如果您的CSV文件不起作用,只是通过电子邮件发送代表文件的样本,我会看看我能做些什么来得到它的工作。
如果你尝试过这个应用程序时,一定要评分:D。谈论Reddit上的应用程序在这里:http://www.reddit.com/r/valeonom功能要求?错误?注释?或其他任何东西都欢迎。
<b>时间格式
用最好的日期和时间格式如下
YYYY-MM-DD HH:MM:SSž例如:2014-12-31 23点59分59秒-0800
YYYY-MM-DD HH:MM:SS例如:2014-12-31 23:59:59
YYYY-MM-DD HH:MM例如:2014-12-31 23:59
YYYY-MM-DD比如:2014-12-31
有受支持其他人。如果您正在生成CSV文件,并希望最好的支持/性能使用上述之一,因为它最大限度地减少不确定性。
默认情况下,如果没有指定假定时区GMT。此外,在图中显示的时区为GMT。这意味着,如果是指定你的时区不是GMT(例如您的本地时间),那么图中的垂直线天将的时候如果有一天改变它是GMT。
</b></div> <div class="show-more-end">


